
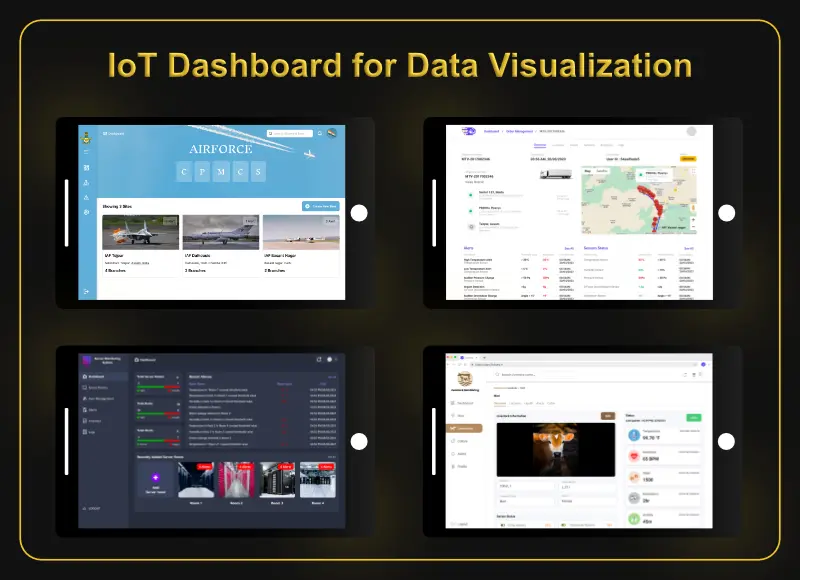
Turning Raw Data Into Understandable Insight
Collecting sensor data is only valuable if someone can actually make sense of it quickly. Once an embedded system has captured and transmitted that data, a well-designed dashboard is what turns the resulting stream into something a person can glance at and immediately understand — a live graph, a simple status indicator, a trend line that tells its own story.
Key Elements of an Effective Dashboard
The best dashboards are built around a simple idea: the most important information should require the least effort to find. A real-time status view puts the critical numbers front and center, so nobody has to dig through menus during a moment that matters. Historical trend graphs add another layer, revealing patterns that a single reading never could — a slow, gradual rise in temperature over weeks, for instance, or a recurring spike that only shows up at a certain time of day. And clear alert indicators, using color and icons rather than plain numbers, make it obvious at a glance when something has drifted outside its normal range.
Accessibility Across Devices
A dashboard that only works well on one screen size quickly becomes a bottleneck. The person checking equipment status might be standing on the shop floor with a phone in hand, sitting in a control room with a large monitor, or reviewing things remotely from a laptop. Designing for all three from the start means nobody is left waiting to get back to a desk just to check whether everything is running normally.
Avoiding Information Overload
Perhaps the most common mistake in dashboard design is trying to show everything at once. When every metric competes for attention, none of them actually stand out, and the dashboard becomes something people learn to ignore. The better approach favors restraint: surface what matters most by default, and keep the deeper diagnostic detail just one click away for the moments it is actually needed.
Want a Dashboard Built Around Your Equipment?
RunTechEngineer designs monitoring dashboards that translate technical sensor data into insight people can actually use, day in and day out.
A clear dashboard is also what makes automation and alerts possible — or Contact Us to discuss your monitoring needs.
Pingback: ESP32 vs Arduino: Which Board to Choose? | RunTechEngineer