The Short Answer
Fatigue failure is the cracking and eventual breaking of a part under loads that are repeated many times, even though each load is well below the strength of the material.
A part that easily carries a load once can still fail after that load has been applied thousands or millions of times. The damage builds up slowly as a crack, usually with no visible warning, and the final break is sudden. This is why fatigue is often estimated to be behind the majority of mechanical failures in service.
A simple example is a paper clip. You cannot break it by bending it once, but bend it back and forth a few dozen times and it snaps.
Fatigue Failure vs Static Failure
It helps to compare the two ways a part can break.
| Static failure | Fatigue failure | |
|---|---|---|
| Cause | One load that exceeds the material’s strength | Many repeated loads below the material’s strength |
| Time to fail | Immediate | Weeks, months, or years |
| Warning | Usually visible bending or stretching first | Usually none until the final break |
| Where it starts | The most highly stressed section | A small stress raiser such as a corner, hole, or scratch |
| Checked by | Stress analysis against yield strength | Fatigue analysis against the number of load cycles |
A design that passes a static stress check is not automatically safe from fatigue. The two must be checked separately. For the static side, see our guide to predicting mechanical failure with FEA.
The Three Stages of Fatigue Failure
Every fatigue failure follows the same sequence.
Stage 1: Crack initiation. A microscopic crack forms at a point where the local stress is highest. This is almost always at the surface, at a feature such as a sharp corner, a thread root, a machining mark, or a small defect in the material.
Stage 2: Crack propagation. Each load cycle opens the crack slightly and extends it by a tiny amount. The part continues to work normally during this stage, which usually accounts for most of its life. The crack is often too small to notice without inspection.
Stage 3: Final fracture. The crack reduces the remaining cross-section until it can no longer carry the load. The rest of the part then breaks in a single cycle.
How to Recognise a Fatigue Failure
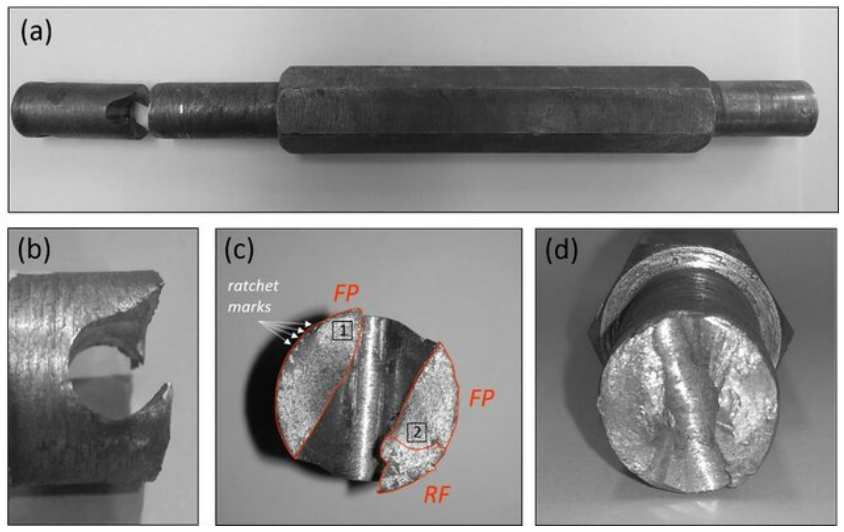
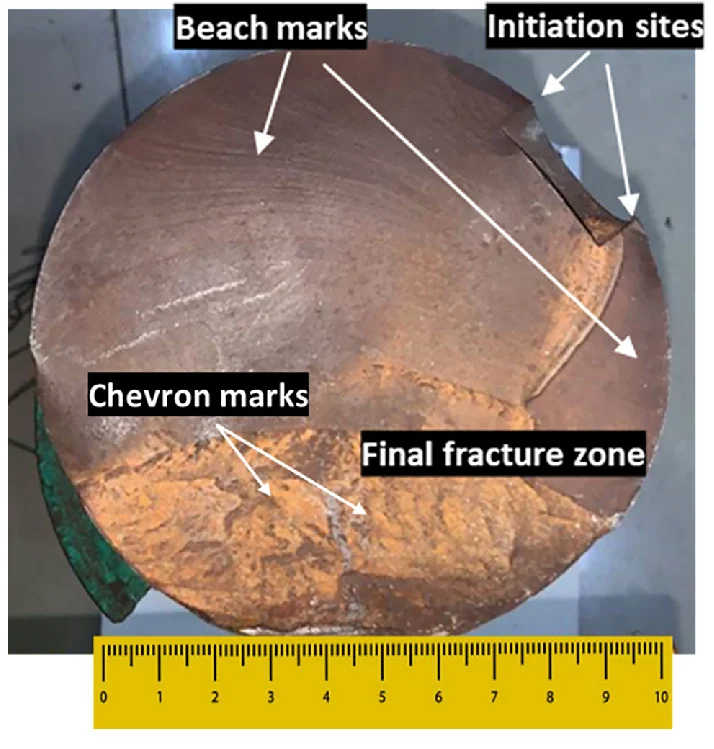
The fracture surface of a broken part usually shows what happened. A fatigue fracture has two distinct zones:
- A smooth zone where the crack grew slowly. It often shows curved lines called beach marks, which spread outward from the point where the crack started, like rings in a tree.
- A rough zone where the final break occurred. It looks grainy or torn.
Two more clues are useful:
- The beach marks point back to the origin, which tells you which feature started the crack.
- The size of the rough zone indicates the load. A small rough zone means the part was lightly loaded and survived a long time. A large one means the part was heavily loaded.
There is also very little bending or stretching around a fatigue fracture, even in a ductile metal such as mild steel.
Stock photo sites rarely have a clear fracture surface. A photo of a failed part from your own work is the best choice for this slot.
What Causes Fatigue Failure?
Fatigue needs a repeated load, but several factors decide how quickly it leads to failure.
- Stress concentrations. Sharp internal corners, holes, keyways, threads, and weld toes raise the local stress to several times the average value. Most fatigue cracks start at one of these.
- Surface condition. Rough machining marks, scratches, and corrosion pits act as small notches. A polished part lasts much longer than a rough one of the same shape.
- Load range. The difference between the highest and lowest stress in each cycle matters more than the peak alone. A load that fully reverses is more damaging than one that only pulses.
- Tensile mean stress. A steady tension added to the cyclic load, including residual tension left by welding or grinding, shortens fatigue life.
- Corrosion. A corrosive environment and cyclic loading together cause far faster cracking than either does alone.
- Material defects. Inclusions, porosity in castings, and voids between layers in 3D printed parts all give cracks a place to start.
- Temperature cycles. Repeated heating and cooling makes a part expand and contract against its supports. This is called thermal fatigue.
The S-N Curve and the Endurance Limit
Fatigue behaviour is described by an S-N curve. It plots the stress applied in each cycle (S) against the number of cycles the material survives before it fails (N).
The curve shows two things:
- The lower the stress, the more cycles the part survives.
- For some materials there is a stress level below which the part can be loaded almost indefinitely. This is the endurance limit, also called the fatigue limit.
Steels and titanium alloys generally have an endurance limit. For many steels it is roughly half the ultimate tensile strength. Aluminium alloys do not have a true endurance limit: they will eventually fail at any stress level if the cycles continue for long enough. For aluminium, designers use the fatigue strength at a stated number of cycles instead.
Fatigue is also divided by the number of cycles involved:
- High-cycle fatigue involves low stress, where the material stays elastic, and lives from roughly a hundred thousand cycles upward. Rotating shafts and vibrating brackets are typical cases.
- Low-cycle fatigue involves higher stress that causes a small amount of permanent deformation in each cycle, and lives of thousands of cycles or fewer. Pressure vessels and parts under thermal cycling are typical cases.
How to Prevent Fatigue Failure
Most fatigue problems are solved in the design stage, and the changes are often small.
- Use generous radii. Replacing a sharp internal corner with a fillet is the single most effective change in many designs.
- Improve the surface finish in highly stressed areas, and avoid stamping part numbers or leaving tool marks there.
- Move holes and welds away from the most highly stressed regions.
- Reduce the load range by stiffening the part, adding support, or isolating it from vibration.
- Add compressive stress at the surface with shot peening or surface rolling. Cracks do not grow easily through compressed material.
- Tighten bolts to the correct preload. A properly preloaded bolt sees only a small part of the changing load. A loose bolt sees all of it.
- Protect against corrosion with coatings, plating, or a more suitable material.
- Inspect critical parts at planned intervals so that cracks are found during stage 2, before the final fracture.
How Fatigue Analysis Predicts Failure
It is possible to estimate fatigue life before a part is made. This is the purpose of fatigue analysis, which is normally done with FEA.
The process has four steps:
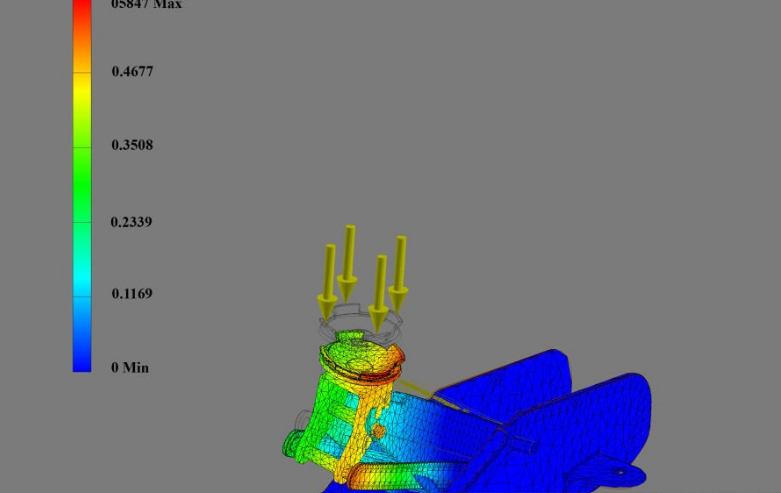
- Run a stress analysis. FEA calculates the stress at every point in the part under its working loads, including the peaks at corners and holes.
- Define the load history. This is how the load changes over time: constant amplitude, fully reversed, or a recorded variable history.
- Apply the material’s fatigue data. The software compares the stress in each cycle with the S-N curve and corrects for mean stress.
- Read the results. Typical outputs are the predicted life in cycles, the accumulated damage, and a fatigue safety factor, shown as a colour map on the model.
The result shows where the first crack is likely to start and how long the part should last. If the life is too short, the geometry can be changed and the analysis repeated in hours, which is far cheaper than discovering the problem in a physical test or in service.
Fatigue analysis has limits. Fatigue data has natural scatter, and the result is only as good as the loads and material data that go into it. For critical parts, the prediction should be confirmed by testing.
Fatigue analysis is one type of structural simulation. If you are unsure which kind of simulation your design needs, see our comparison of FEA vs CFD. For parts that fail because of repeated heating and cooling, thermal simulation provides the temperature loads.
Frequently Asked Questions
What is the difference between fatigue failure and fatigue analysis? Fatigue failure is the event: a part cracks and breaks under repeated loading. Fatigue analysis is the engineering method used to predict when that will happen and to prevent it.
Can fatigue failure happen below the yield strength? Yes. This is what makes it dangerous. Fatigue cracks commonly grow at stresses well below the yield strength, in parts that would pass a normal stress check.
Can a fatigue crack be detected before the part breaks? Often, yes. Dye penetrant, magnetic particle, ultrasonic, and eddy current inspection can all find cracks during the propagation stage, if the part is inspected at the right location.
Do plastics and 3D printed parts suffer from fatigue? Yes. All structural materials do. In 3D printed parts the bonds between layers are common starting points, so the print orientation has a strong effect on fatigue life.
How many cycles does it take to cause fatigue failure? It depends on the stress level. A heavily loaded part can fail in a few thousand cycles, while a lightly loaded one can survive hundreds of millions. A shaft turning at 1,500 RPM completes more than two million cycles in a single day, so high cycle counts are reached quickly.
Concerned About Fatigue in Your Design?
RunTechEngineer provides fatigue analysis services for mechanical parts and assemblies, from identifying where a crack is likely to start to recommending design changes that extend service life. If a part has already failed, we can also help determine why.
Learn more about our failure and fatigue analysis, or Contact Us to discuss your part.