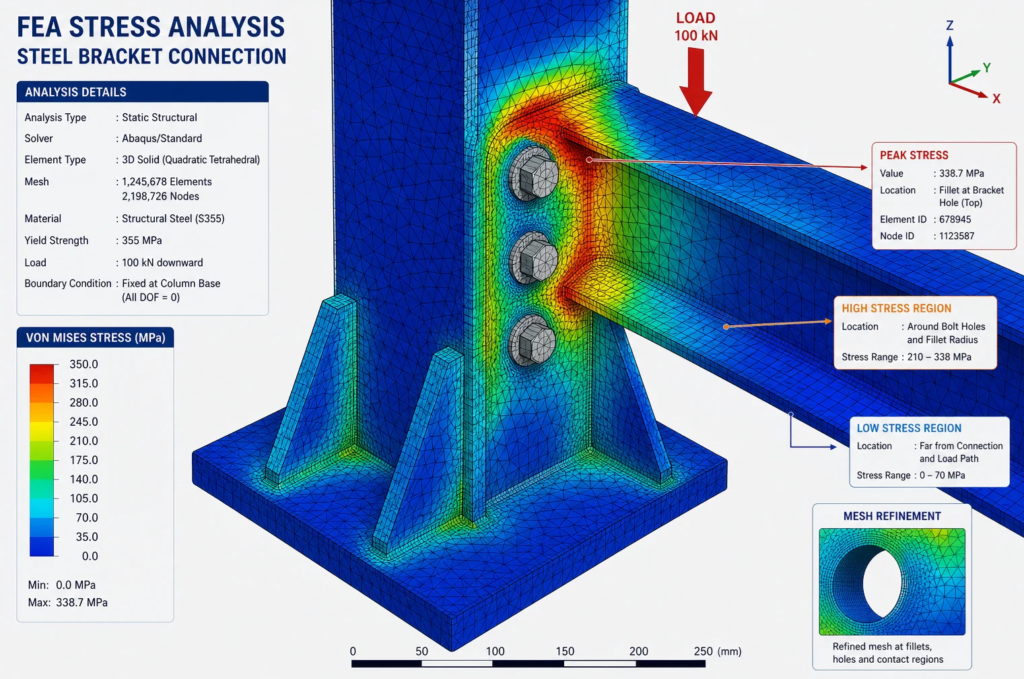
Predicting mechanical failure with FEA means comparing the stress the simulation calculates against a limit the material can take, and reading the result as a safety factor. If the highest stress in a steel bracket is 150 MPa and the steel yields at 250 MPa, the safety factor against yielding is 1.67.
The arithmetic is simple. The hard part is making sure the 150 MPa is real: that the loads, supports, material, and mesh describe the actual part. This guide covers which failures FEA can predict, a worked example with a hand check, and the mistakes that produce confident wrong answers.
What FEA Can and Cannot Predict
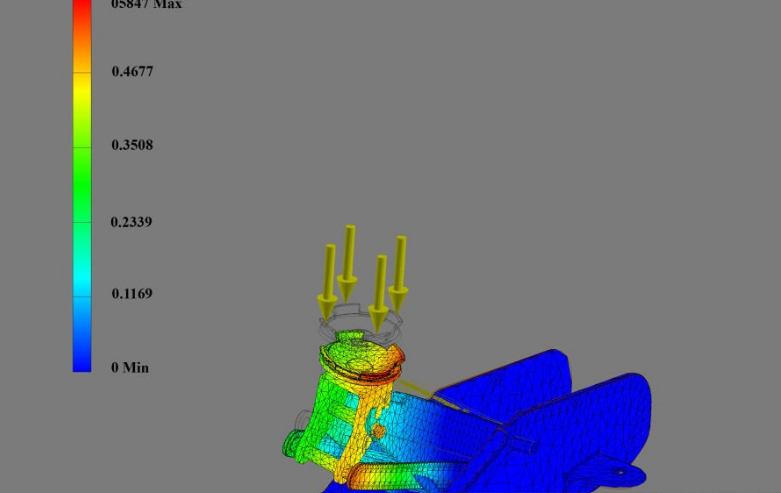
Finite element analysis divides a part into small elements and calculates how each one deforms under load. From that it reports stress, strain, and displacement everywhere in the part. Whether the part fails is a second step: you compare those results with a failure criterion. New to the method? Start with what finite element analysis is.
| Failure mode | What you check in FEA | Compared against |
|---|---|---|
| Yielding (permanent bending) | Von Mises stress | Yield strength |
| Fracture of brittle materials | Maximum principal stress | Ultimate tensile strength |
| Excessive deflection | Displacement | The allowable movement for the design |
| Buckling | Buckling load factor from a buckling study | A factor above 1, with margin |
| Fatigue | Stress range per load cycle | The material’s S-N data |
| Thermal stress | Stress from a thermal-structural study | Yield strength |
FEA does not predict failure caused by things you did not model. Material defects, poor welds, corrosion, loose bolts, a load case nobody thought of, and manufacturing errors are outside the simulation unless you put them in. A clean result means the design is adequate for the loads you defined, not that the part cannot fail.
Fatigue deserves a separate note. A part can pass a static check with a comfortable margin and still crack after months of repeated loading. That is a different analysis with its own data, covered in our guide to fatigue failure.
A Worked Example: A Steel Support Arm
Take a flat steel bar used as a support arm. One end is bolted rigidly to a frame, and a load hangs from the free end.
| Input | Value |
|---|---|
| Length from support to load | 200 mm |
| Width | 40 mm |
| Thickness | 10 mm |
| Load at the free end | 500 N (about 51 kg) |
| Material | ASTM A36 structural steel |
| Yield strength | 250 MPa |
| Elastic modulus | 200 GPa |
Step 1: Calculate by hand first
For a simple shape you can estimate the answer before opening the software. This is the most useful habit in simulation, because it tells you what a sensible result looks like.
The highest bending stress in a rectangular cantilever is at the fixed end:
stress = 6 x F x L / (b x h^2)
       = 6 x 500 x 200 / (40 x 10^2)
       = 150 MPa
The deflection at the free end is:
I          = b x h^3 / 12 = 40 x 10^3 / 12 = 3,333 mm^4
deflection = F x L^3 / (3 x E x I)
           = 500 x 200^3 / (3 x 200,000 x 3,333)
           = 2.0 mm
Step 2: Build the model
- Geometry: the bar as designed, including any holes and fillets.
- Material: A36 steel, with the modulus and yield strength above.
- Support: the bolted end fixed.
- Load: 500 N downward on the free end, spread over the area where it is really applied, not on a single point.
- Mesh: start coarse, then refine around the fixed end and any holes.
Step 3: Compare the result with the hand calculation
A correct model should report a stress close to 150 MPa on the top and bottom surfaces near the fixed end, and about 2 mm of movement at the tip. If the software shows 15 MPa or 1,500 MPa, the model is wrong, usually because of units, a missing support, or a load applied in the wrong direction.
Step 4: Calculate the safety factor
safety factor = yield strength / highest stress
              = 250 / 150
              = 1.67
The arm will not yield under this load, but the margin is modest. Whether 1.67 is enough depends on how well you know the load and what happens if the arm fails.
Step 5: Look at what the hand calculation missed
This is where FEA earns its place. Suppose the arm has a mounting hole near the fixed end. The hand formula ignores it, but stress rises sharply at the edge of a hole. For a small hole in a wide plate under tension the theoretical increase is a factor of three, and other shapes give other values. FEA calculates the actual figure for your geometry.
If the local stress at the hole exceeds 250 MPa, the material there yields even though the rest of the arm is well below the limit. Under a single static load, a small yielded zone in ductile steel is often acceptable. Under repeated loading it is where a fatigue crack starts.
Step 6: Change the design and run it again
Increasing the thickness from 10 mm to 12 mm gives:
| 10 mm thick | 12 mm thick | |
|---|---|---|
| Bending stress | 150 MPa | 104 MPa |
| Safety factor against yield | 1.67 | 2.40 |
| Tip deflection | 2.0 mm | 1.2 mm |
A 20% increase in thickness cuts the stress by about 30% and the deflection by about 42%, because stress depends on thickness squared and stiffness on thickness cubed. Moving the hole away from the high-stress region, or enlarging a fillet, is often cheaper still. Comparing options like this is the subject of design optimization.
How Much Safety Factor Is Enough?
There is no single correct value. It depends on how certain the loads and material properties are, and on the consequence of failure.
| Application | Typical safety factor |
|---|---|
| Non-critical components | About 2 |
| Building structural members | About 2 |
| Automobiles | About 3 |
| Pressure vessels | 3.5 to 4 |
| Aircraft structure | Commonly 1.5, where weight is critical and loads are well tested |
| Parts whose failure could cause death or serious injury | 4 or higher |
These are general figures. Where a design code or standard applies to your product, the required factor comes from that code, not from a table like this.
Choosing the Right Failure Criterion
The software will plot many kinds of stress. Which one you compare against the material limit depends on the material.
- Ductile metals (steel, aluminium, most engineering alloys): use von Mises stress and compare it with yield strength. The von Mises criterion combines the stresses in all directions into one value, and yielding begins when that value reaches the yield strength measured in a simple tensile test.
- Brittle materials (cast iron, ceramics, many rigid plastics): these break without yielding first, and are much weaker in tension than in compression. Check the maximum principal (tensile) stress against the tensile strength.
- Composites and 3D printed parts: strength depends on direction, so a single yield value does not describe them. They need direction-specific limits and a larger margin.
Using von Mises stress on a brittle material is one of the more common ways to get a result that looks safe and is not.
Mistakes That Give False Results
- Wrong supports. A “fixed” face in the software is perfectly rigid. Real bolted joints and welded frames flex. Over-constrained models hide stress, and under-constrained ones invent it.
- Point loads. A force applied to a single point or edge produces a stress that climbs without limit as the mesh gets finer. Spread the load over the real contact area.
- Trusting the peak at a sharp corner. A perfectly sharp internal corner is a singularity: the reported stress keeps rising with every mesh refinement and never settles. Model the real fillet radius, or judge the stress a short distance away.
- No mesh convergence check. Refine the mesh and run again. If the stress in the area of interest changes by more than a few percent, the mesh was too coarse.
- Wrong material data. Yield strength varies with grade, heat treatment, and thickness. Use the value for the material you will actually buy.
- Linear analysis beyond its limits. A standard static study assumes the material stays elastic and deflections are small. Once the stress passes yield, the numbers it reports are no longer physical.
- Missing load cases. Parts often fail from the load nobody modelled: a dropped tool, an overtightened bolt, thermal expansion, or handling during assembly. For heat-driven loads see thermal simulation.
- Checking stress only. A part can be strong enough and still fail by buckling or by deflecting too far.
Validate Before You Rely on It
A simulation is a prediction, and predictions should be checked.
- Compare with a hand calculation for a simplified version of the part.
- Check that the reaction forces at the supports equal the loads you applied.
- Look at the deformed shape, exaggerated, and ask whether it moves the way the real part would.
- For anything safety-critical, test a physical part and compare.
Frequently Asked Questions
Can FEA predict when a part will fail?
It can predict whether a part will yield, fracture, buckle, or deflect too far under the loads you define, and with a fatigue study it can estimate how many load cycles the part will survive. It cannot predict failures from causes left out of the model, such as defects, corrosion, or unexpected loads.
What is a good safety factor in FEA?
About 2 is common for non-critical parts with well-understood loads. Use more when loads are uncertain or failure would be dangerous, and follow the design code where one applies.
What is von Mises stress?
A single value that combines the stresses acting in all directions at a point. For ductile metals, yielding starts when the von Mises stress reaches the material’s yield strength, which is why it is the default stress plot in most FEA software. See our full guide to von Mises stress.
How accurate is FEA?
For a well-built linear model of a metal part, results within a few percent of test are realistic. Most error comes from the inputs, meaning the loads, supports, and material data, not from the solver.
Do I need FEA for a simple part?
Not always. If a hand calculation covers the shape, as with the plain bar above, FEA adds little. It becomes worth the effort when the geometry has holes, fillets, ribs, or several loads acting together. If your problem involves fluid flow, see FEA vs CFD.
Want to Know Where Your Design Will Fail First?
RunTechEngineer runs structural FEA on parts and assemblies, checks the result against hand calculations, and reports the weak points with recommended changes. For parts under repeated load we add failure and fatigue analysis. See our mechanical simulation services, or contact us with your model and load conditions.