
Why a Part Can Pass a Static Check and Still Fail
Fatigue analysis predicts how many load cycles a part can survive before a crack starts and grows to failure. It answers a question a static check cannot: not “will it break under the worst load?” but “how long will it last under the loads it sees every day?”
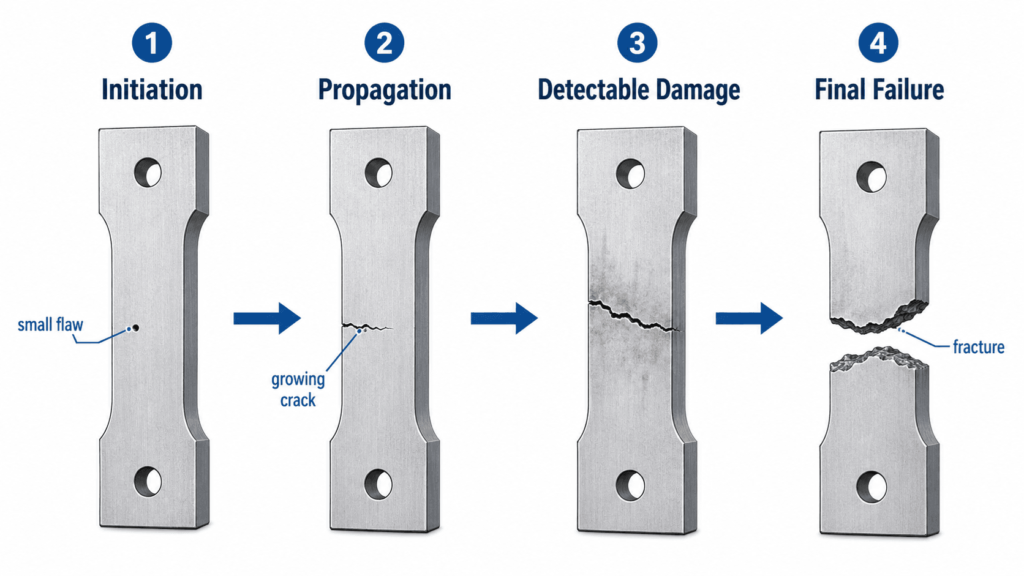
A bracket can pass a static FEA check with a comfortable safety factor and still crack after a few months of normal use. Each load cycle does a small amount of damage, even when the stress stays well below yield. The damage adds up until a crack forms, usually at a sharp corner, a hole, or a weld. Our guide to fatigue failure explains the mechanism and how to recognise a fatigue fracture. This article covers how to analyse and predict it.
What Fatigue Analysis Predicts
A fatigue analysis normally delivers four results:
- Fatigue life: the number of cycles, hours, or years until a crack is expected.
- Damage: the fraction of that life used up by a given load history.
- Fatigue safety factor: how far the stresses could rise before the target life is no longer met.
- Critical locations: where the first crack will start, so the design can be changed there.
The Three Methods of Fatigue Analysis
The right method depends on how many cycles the part sees and whether the material yields locally.
| Method | What it uses | Best for |
|---|---|---|
| Stress-life (S-N) | Stress amplitude and an S-N curve for the material | High-cycle fatigue, where stresses stay elastic: shafts, brackets, frames, most machine parts |
| Strain-life (ε-N) | Local strain, including plastic strain at notches | Low-cycle fatigue: few but heavy cycles, such as start-stop loads or pressure cycling |
| Crack growth (fracture mechanics) | The size of an existing crack and how fast it grows per cycle | Welded structures and parts with known flaws, and setting inspection intervals |
Stress-life is the most common method for machine design. Strain-life is used when local stresses at a notch exceed yield. Crack growth assumes a crack is already there and asks how long until it becomes critical.
How a Fatigue Analysis Is Done
A stress-life fatigue analysis follows the same steps whether it is done by hand or in FEA software.
- Define the load history. List every load the part sees and how often: start-up, normal running, peaks, vibration. Measured data is best; a specified duty cycle is the minimum.
- Find the stresses. Use hand calculations for simple shapes and finite element analysis for real geometry. The mesh must be fine at fillets, holes, and other stress raisers, because that is where cracks start.
- Count the cycles. Real load histories are irregular. Rainflow counting, described in ASTM E1049, breaks them into individual cycles, each with an amplitude and a mean stress.
- Correct for mean stress. A cycle that swings around a tensile mean is more damaging than one that swings around zero. Goodman, Gerber, or Soderberg corrections account for this.
- Correct the material data. Published S-N curves come from small, polished test specimens. Real parts need corrections for surface finish, size, temperature, and the reliability you require.
- Add up the damage. Miner’s rule sums the damage from every block of cycles, as in the example below.
- Report the life and the margin. Compare the predicted life with the required service life and identify the location that limits it.
Miner’s Rule: A Worked Example
Miner’s rule (the Palmgren-Miner rule) says that each block of cycles uses up a fraction of the part’s life. Failure is predicted when the fractions add up to 1.
Damage D = n₁/N₁ + n₂/N₂ + n₃/N₃ + …
Here n is the number of cycles applied at a stress level, and N is the number of cycles to failure at that level, read from the S-N curve.
Take a steel bracket on a machine that runs three kinds of load each year. The S-N values below are illustrative, not data for a specific steel.
| Load block | Stress amplitude | Cycles per year (n) | Cycles to failure (N) | Damage (n ÷ N) |
|---|---|---|---|---|
| Start-up peaks | 200 MPa | 20,000 | 200,000 | 0.10 |
| Normal running | 150 MPa | 100,000 | 1,000,000 | 0.10 |
| Vibration | 100 MPa | 5,000,000 | Below the endurance limit | 0 |
| Total per year | 0.20 |
A damage of 0.20 per year predicts a life of 1 ÷ 0.20 = 5 years.
Two points matter here. The vibration block adds nothing only because this steel has an endurance limit; aluminium has no true endurance limit, so the same block would add damage. And Miner’s rule ignores the order in which loads occur, so real lives can be shorter or longer than predicted. Treat the result as an estimate with scatter, not a guaranteed date.
Why Mean Stress Changes the Answer
Two parts can see the same stress swing and have very different lives. A swing from 0 to 200 MPa sits on a tensile mean of 100 MPa and does more damage than a swing from −100 to +100 MPa.
The Goodman line is the most common correction. It reduces the allowable stress amplitude as the mean stress rises:
σa / Se + σm / Sut = 1 / n
Here σa is the stress amplitude, σm the mean stress, Se the corrected endurance limit, Sut the ultimate tensile strength, and n the fatigue safety factor. Goodman is conservative for most steels. Gerber is less conservative, and Soderberg more so.
What Changes Fatigue Life Most
Small details often matter more than the choice of material.
| Factor | Effect on fatigue life | What to do |
|---|---|---|
| Stress concentrations | Sharp corners, holes, and keyways multiply local stress | Use generous fillet radii and move holes away from high-stress areas |
| Surface finish | Rough or machined surfaces start cracks sooner than polished ones | Specify the finish at critical locations |
| Residual stress | Tensile residual stress shortens life; compressive stress extends it | Shot peening helps; welds and some machining hurt |
| Welds | Weld toes act as built-in cracks | Use weld detail categories from the relevant design code |
| Material | Many steels have an endurance limit, roughly half the tensile strength; aluminium has none | Never assume infinite life for aluminium |
| Environment | Corrosion and heat reduce fatigue strength | Account for the real operating environment |
Common Mistakes in Fatigue Analysis
- Relying on a static safety factor alone. A part with a static safety factor of 3 can still fail in fatigue.
- Using S-N data from polished specimens without corrections. Real parts are rougher and larger, and they fail sooner.
- A coarse mesh at the critical location. Peak stress at a fillet is underestimated, and fatigue life is overestimated, often by a large factor.
- Ignoring mean stress. Bolted joints, press fits, and pressurised parts carry a mean stress that cuts their life.
- Treating Miner’s rule as exact. Fatigue data scatters widely. Many designers aim for damage well below 1 to leave a margin.
- Assuming low stress means infinite life in aluminium. It does not have an endurance limit.
When You Need a Fatigue Analysis
A fatigue analysis pays off whenever loads repeat many times and a failure would be expensive or unsafe:
- Rotating shafts, couplings, and gears
- Brackets and frames on vibrating machinery
- Drone arms and frames, which see vibration and repeated landing loads (see our drone structural simulation)
- Welded frames and structures
- Parts loaded by pressure or temperature cycles
- Lightweight parts that have been through design optimization, where material was removed to save weight
Frequently Asked Questions
What is fatigue analysis?
Fatigue analysis predicts how many load cycles a part can survive before it cracks. It combines the loads the part sees, the stresses those loads create, and the fatigue properties of the material.
What is the difference between fatigue analysis and static stress analysis?
Static analysis checks whether a part yields or breaks under its largest load. Fatigue analysis checks how long it lasts under loads that repeat, even when each one is well below yield.
What is Miner’s rule?
Miner’s rule adds up the fraction of fatigue life used by each block of load cycles. Failure is predicted when the total reaches 1.
Can FEA do fatigue analysis?
Yes. FEA finds the stresses at every point, and a fatigue solver applies the load history, S-N data, and corrections to predict life at each location. The result is only as good as the mesh at stress raisers and the load data put in.
How accurate is fatigue life prediction?
Predictions are estimates, because fatigue test results scatter widely even for identical specimens. They are most useful for comparing designs, finding the weakest location, and checking that the margin is large enough.
Need to Know How Long Your Design Will Last?
RunTechEngineer runs fatigue analysis on parts and assemblies: defining the load history, building the FEA model, and predicting life at the critical locations. Where the life is too short, we show which change gains the most, which is often a local fix rather than reinforcing the whole part.
See our finite element analysis services, or contact us with your part, its material, and how it is loaded.

Pingback: FEA vs CFD: What's the Difference? | RunTechEngineer
Pingback: FEA Services: Stress Analysis for Parts and Assemblies