An S-N curve shows how many load cycles a material survives at a given stress. S stands for the stress amplitude of each cycle, and N for the number of cycles to failure. Read from left to right, the curve falls: the lower the stress, the longer the life. It is the basic tool for predicting fatigue life, the slow cracking of parts under repeated loads well below their static strength.
This guide explains how to read an S-N curve, what the endurance limit means, how the Basquin equation describes the curve, how to estimate an S-N curve for steel when no test data is available, and how to use it in a worked example.
How to Read an S-N Curve
S-N curves are almost always drawn on log-log axes, because life spans from a few hundred to many millions of cycles. Each point comes from a test: a specimen is loaded at one stress amplitude until it breaks, and the cycle count is recorded. Classic data come from rotating-beam tests, where a polished round specimen spins under bending, so every point on its surface sees fully reversed stress.
| Region | Cycles | What happens |
|---|---|---|
| Low-cycle fatigue | Below about 1,000 | Stress near yield; small plastic strain every cycle |
| High-cycle fatigue | About 1,000 to 1,000,000 | Elastic stress; the sloped part of the curve |
| Long life | Beyond about 1,000,000 | Steels flatten at the endurance limit; aluminum keeps falling |
The exact boundaries vary between textbooks, but the shape is consistent. Real test data also scatter widely, so a published curve usually represents a median: about half of the specimens last longer.
Endurance Limit vs Fatigue Strength
Many steels and titanium alloys show an endurance limit: a stress amplitude below which the curve becomes flat, so the part can, in theory, survive an unlimited number of cycles. For many steels it is roughly half the ultimate tensile strength.
Aluminum alloys have no true endurance limit. Their curve keeps falling, so data sheets give a fatigue strength at a stated number of cycles instead. Aluminum 6061-T6, for example, is commonly quoted at about 97 MPa for 500 million fully reversed cycles. A design in aluminum must therefore state its required life; “infinite life” does not exist.
The Basquin Equation
The sloped high-cycle part of an S-N curve is a straight line on log-log axes. The Basquin equation describes that line:
σa = a · N^b
Here σa is the stress amplitude, N is the cycles to failure, and a and b are constants for the material and condition. The exponent b is negative and small, usually around −0.05 to −0.15. Rearranged, the life at a given stress is:
N = (σa / a)^(1/b)
Because b is small, life is extremely sensitive to stress: a modest drop in stress can multiply the life several times, as the example below shows.
Estimating an S-N Curve for Steel
When no fatigue data exist for a part, machine design textbooks such as Shigley’s use an approximate method based on ultimate tensile strength (Sut):
- Unmodified endurance limit: about 0.5 × Sut for steels up to 1,400 MPa, capped at about 700 MPa above that.
- Correct it for the real part with Marin factors: surface finish (ka), size (kb), load type, temperature, reliability, and other effects. Se = ka · kb · … · 0.5 Sut.
- Anchor the curve at 1,000 cycles at about 0.9 × Sut, a common textbook approximation.
- Draw a straight line on log-log axes from that point to Se at 1,000,000 cycles. That line gives the Basquin constants.
The surface factor matters most for machined parts: ka = 4.51 · Sut^−0.265 for machined or cold-drawn steel (Sut in MPa). Polished test specimens give the uncorrected value; a real part never matches it.
Worked Example: Fatigue Life of a Steel Shaft
A machined steel shaft, 20 mm in diameter, rotates under bending. Its steel has an ultimate tensile strength of 600 MPa. The shaft sees fully reversed bending stress. These are round numbers for illustration, at room temperature and median reliability.
| Step | Calculation | Result |
|---|---|---|
| Unmodified endurance limit | 0.5 × 600 MPa | 300 MPa |
| Surface factor ka, machined | 4.51 × 600^−0.265 | 0.83 |
| Size factor kb, 20 mm in bending | (20 / 7.62)^−0.1133 | 0.90 |
| Corrected endurance limit Se | 0.83 × 0.90 × 300 MPa | about 223 MPa |
| Strength at 1,000 cycles | 0.9 × 600 MPa | 540 MPa |
| Basquin constants | a = 540² / 223, b = −⅓ log(540 / 223) | a ≈ 1,310 MPa, b ≈ −0.128 |
With the curve defined, the life at any stress amplitude follows from N = (σa / 1,310)^(1 / −0.128):
| Stress amplitude | Predicted life |
|---|---|
| 350 MPa | about 29,000 cycles |
| 300 MPa | about 98,000 cycles |
| 250 MPa | about 405,000 cycles |
| 200 MPa | Below the endurance limit: no fatigue failure expected |
Cutting the stress amplitude from 300 to 250 MPa, about 17%, raises the predicted life about four times. At 200 MPa the shaft sits below its corrected endurance limit. Note that the polished-specimen value of 300 MPa would have overstated the safe stress by a third.

Using S-N Curves in Real Design
- Use corrected values, not specimen data. Surface finish, size, and stress concentrations all lower the curve. Check peak stress at fillets and holes; see von Mises stress.
- Correct for mean stress. S-N curves from rotating-beam tests assume a zero mean. A cycle around a tensile mean is more damaging; the Goodman correction is covered in our guide to fatigue analysis.
- Add up mixed loads. Real parts see several stress levels; Miner’s rule sums the damage from each, as shown in the same guide.
- Keep a margin. Fatigue data scatter, so designers apply a factor of safety on stress or on life; see factor of safety.
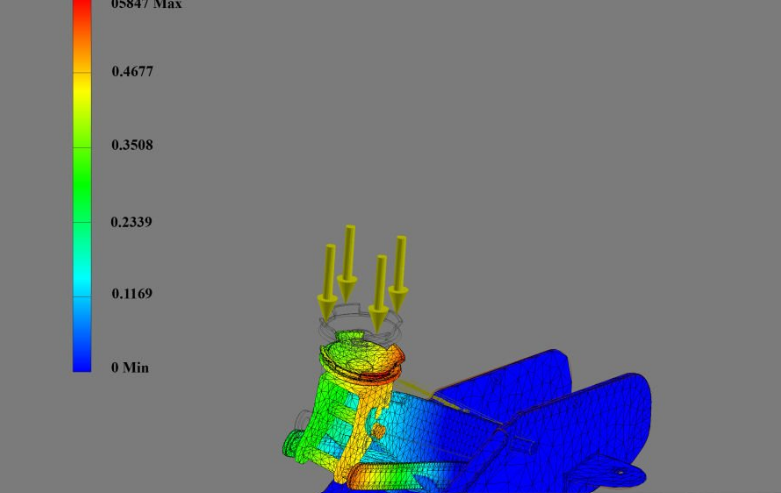
- Get stresses from analysis. For complex shapes, finite element analysis gives the stress amplitude at each location, which is then compared with the S-N curve.
For how fatigue cracks start and grow, and how to recognize a fatigue fracture, see what is fatigue failure.
Frequently Asked Questions
What is an S-N curve?
A plot of stress amplitude (S) against the number of cycles to failure (N) for a material, usually on log-log axes. Lower stress gives a longer life.
What is the endurance limit?
The stress amplitude below which a material, typically steel or titanium, can survive an unlimited number of cycles. For many steels it is roughly half the tensile strength before corrections.
Does aluminum have an endurance limit?
No. Its S-N curve keeps falling, so a fatigue strength is quoted at a set number of cycles, such as about 97 MPa at 500 million cycles for 6061-T6.
What is the Basquin equation?
A power law, σa = a · N^b, that describes the straight high-cycle part of an S-N curve on log-log axes.
How do you estimate an S-N curve without test data?
Start from about half the tensile strength, correct it with Marin factors for surface, size, and other effects, and join it on log-log axes to about 0.9 × tensile strength at 1,000 cycles.
Need a Fatigue Life Estimate for Your Part?
RunTechEngineer combines FEA stress results with S-N data to estimate fatigue life and show where a design needs more margin. See our FEA services or contact us with your part and its loads.